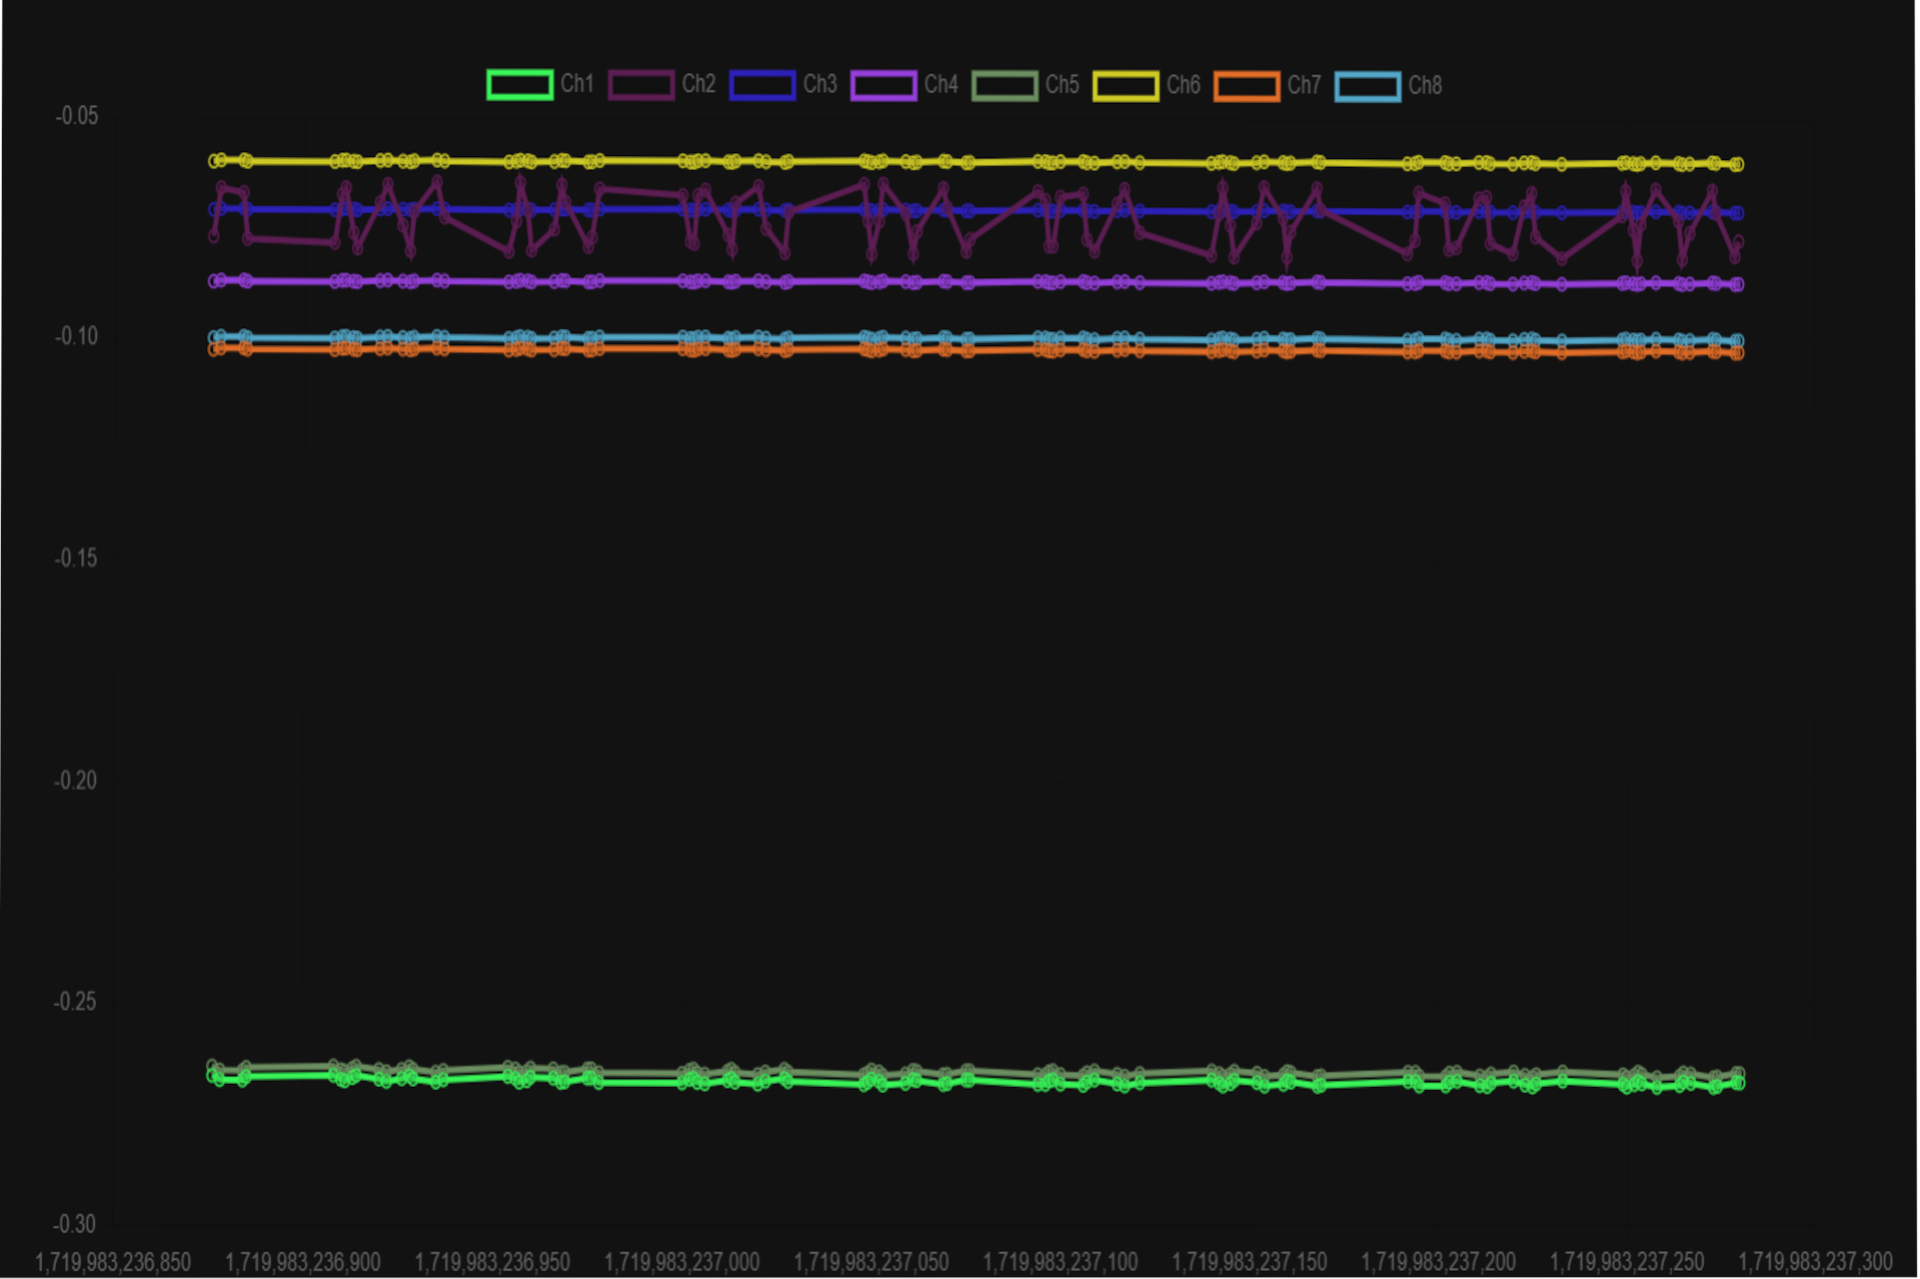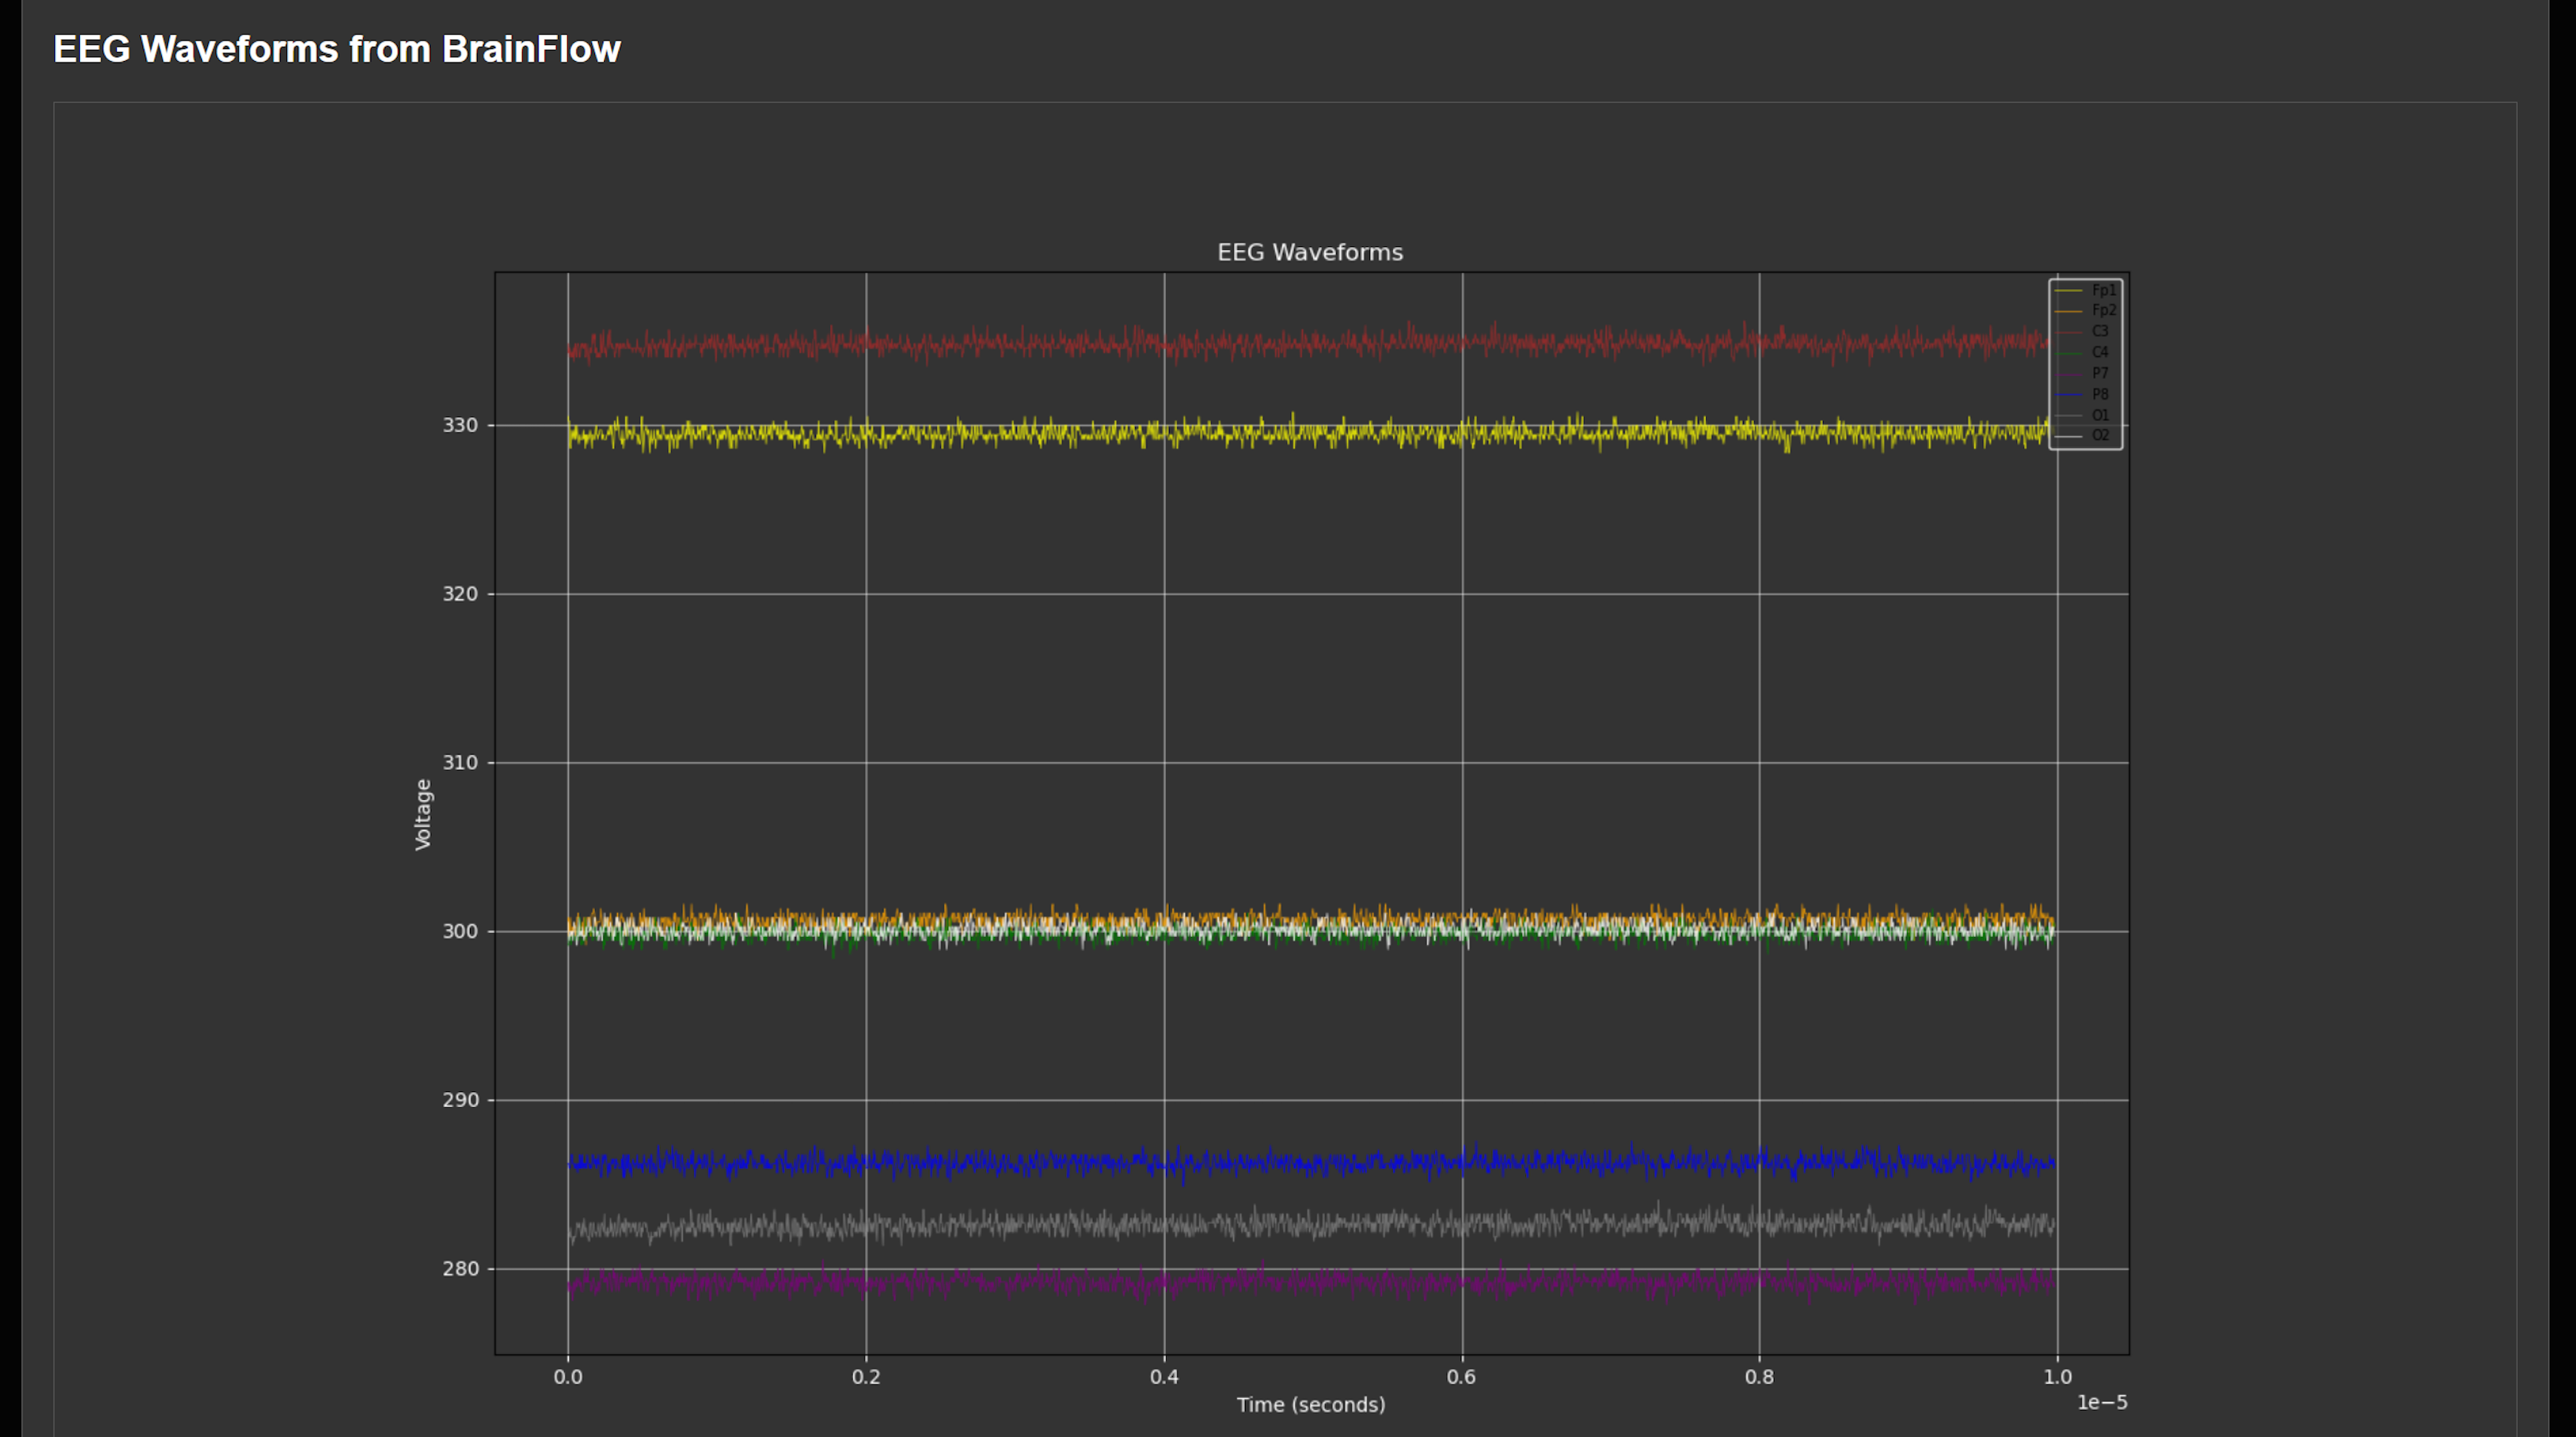
Unleashing the Power of Brain-Computer Interfaces
Welcome back everyone! Today we’re diving deeper into the world of brain-computer interfaces (BCIs), exploring how to build a fully functional, real-time EEG (Electroencephalography) analysis and visualization app using Flask, BrainFlow, and PiEEG.
By the end of this blog you will learn how to bring together hardware, signal processing, and real-time data visualization. This isn’t just a simple “hook it up and watch the graph move” project. We’re implementing advanced features like baseline correction, bandpass filtering, and real-time streaming to give you a robust, interactive tool for analyzing your own brain activity.
Tip: This blog is a continuation of our Step-by-Step Guide to Building a BCI. If you have not built your own BCI yet - go check out Hacking the Mind: A Step-by-Step Guide to Building a BCI.
What You'll Need:
- Brain-Computer Interface: Built to acquire EEG signals.
- VSCode: IDE used in this blog.
- Finished Project: You can find completed project files in the tutorials repo on GitHub.
Part 1: Preparing the Raspberry Pi and Installing Dependencies
Before we get to the fun part, we need to set up our development environment. We’ll be using a Raspberry Pi as the brain of the operation, with a PiEEG board capturing the EEG signals.
Setting Up the Raspberry Pi
From the Raspberry Pi desktop, or via SSH, access the terminal and run the following commands.
-
Update and Upgrade the Pi: This ensures you have the latest security patches and dependencies.
sudo apt-get update sudo apt-get upgrade -y -
Install Essential Libraries: Alongside standard Python libraries, we’ll need to install tools like
cmakeandlibusbto ensure smooth communication with the PiEEG board.sudo apt-get install -y git python3 python3-pip python3-venv build-essential cmake libusb-1.0-0-dev -
Create a Virtual Environment: Always use a virtual environment! This keeps your project dependencies isolated and prevents conflicts with other Python packages.
python3 -m venv eeg_env
source eeg_env/bin/activate
Tip: If you’re new to virtual environments, think of them like sandboxes. They’re isolated areas where you can build your project without worrying about breaking something else on your system.
-
Install Flask and Supporting Libraries: Flask will serve as the backbone of our application. It handles HTTP requests, serves our front-end, and manages WebSocket connections.
pip install flask flask-socketio eventlet numpy
Installing BrainFlow for EEG Data Acquisition
BrainFlow provides a simple yet powerful interface for capturing EEG data. With BrainFlow, you don’t have to worry about low-level SPI or GPIO configuration—that’s all handled under the hood.
Clone the BrainFlow repository and install the package.
# Clone BrainFlow repository
git clone https://github.com/brainflow-dev/brainflow.git

# Install the BrainFlow package
cd brainflow/python-package
python setup.py install
Configuring SPI and GPIO on the Raspberry Pi
To communicate with the PiEEG board, we’ll need to set up the Raspberry Pi’s SPI interface and configure GPIO settings.
-
Enable the SPI Interface using
raspi-config. This step is crucial - without it, your Pi won’t be able to talk to the EEG board.sudo raspi-configNavigate to Interface Options > SPI > Yes.
-
Verify the SPI Setup: Always double-check that the SPI module is active by running
lsmod | grep spi. If you don’t see the module, go back and recheck your configuration.lsmod | grep spi
Part 2: Implementing the Flask Server and Real-Time Data Acquisition
Setting Up the Flask Server
The Flask server will serve as the main hub for managing requests, establishing WebSocket connections, and handling data transmission between the front-end and back-end. We’ll start by setting up the core Flask application along with the Socket.IO integration to enable real-time communication.
Tip: Flask’s simplicity makes it ideal for rapid development, but it’s also powerful enough to handle complex multi-threaded data streams like our EEG project.
Implement a Basic Flask Server:
Start by opening VSCode and creating a new folder for your project. Next, create a new file and name it main.py. This will be the main entry point for our Flask app.
# Import the required libraries
import logging
import json
from flask import Flask, render_template, request, jsonify, Response
import spidev
import gpiod
import threading
import time
from scipy.signal import butter, filtfilt, iirnotch
import numpy as np
from flask_socketio import SocketIO, emit
from brainflow.board_shim import BoardShim, BrainFlowInputParams, BoardIds, BrainFlowError
from brainflow.data_filter import DataFilter, FilterTypes, DetrendOperations
import os
import asyncio
import inspect
import sqlite3
import base64

# Configure logging for detailed information during execution
logging.basicConfig(level=logging.INFO)

# Initialize Flask app and SocketIO for WebSocket support
app = Flask(__name__)
socketio = SocketIO(app)

# Define the main route to serve the web interface
@app.route('/')
def index():
    return render_template('index.html')

# Main entry point of the application
if __name__ == '__main__':
    running = False  # Control variable to manage analysis state
    collected_data = [[] for _ in range(enabled_channels)]  # Initialize data storage for enabled channels
    socketio.run(app, host='0.0.0.0', port=5000, allow_unsafe_werkzeug=True)
Explanation:
- Logging Configuration: Provides detailed runtime information.
- Flask and SocketIO Initialization: Establishes the core server and WebSocket support.
- Main Application Entry: Sets up the app to listen on all network interfaces, allowing remote access for development and testing.
Connecting to the PiEEG Board Using BrainFlow
With BrainFlow, connecting to the PiEEG board is straightforward, but there are a few gotchas. Configuring the serial port correctly is crucial - make sure the params.serial_port value is set to '/dev/spidev0.0'. If it’s set wrong, you’ll spend a lot of time troubleshooting.
Initialize the Board: Update app.py to configure board parameters and initialize necessary variables with default settings.
# BrainFlow specific settings
params = BrainFlowInputParams()
params.serial_port = '/dev/spidev0.0'

# Initialize the variables
enabled_channels = 8  # Default to 8 channels enabled
ref_enabled = True  # Default to REF enabled
biasout_enabled = True  # Default to BIASOUT enabled
fs = 250  # Sampling frequency
bandpass_enabled = False
baseline_correction_enabled = False

# Set up 8 ch for read data
collected_data = []

calibration_values = [0] * 8
Handle GPIO Conflicts: If you’re using multiple sensors, GPIO conflicts can cause unexpected behavior. Implement the check_gpio_conflicts() function in app.py to detect and resolve any issues before starting the analysis.
def cleanup_spi_gpio():
    global spi, chip, line
    try:
        logging.info("Cleaning up SPI and GPIO...")
        if spi:
            spi.close()
            spi = None
            logging.info("SPI closed.")
        if line:
            line.release()
            line = None
            logging.info("GPIO line released.")
        if chip:
            chip.close()
            chip = None
            logging.info("GPIO chip closed.")
    except Exception as e:
        logging.error(f"SPI and GPIO cleanup error: {e}")

def check_gpio_conflicts():
    try:
        # Attempt to open the GPIO line to see if it's already in use
        test_chip = gpiod.Chip('/dev/gpiochip0')
        test_line = test_chip.get_line(26)
        test_line.request(consumer="test", type=gpiod.LINE_REQ_EV_FALLING_EDGE)
        test_line.release()
        test_chip.close()
        return False  # No conflicts
    except Exception:
        return True  # Conflicts detected
Key Points:
- params.serial_port configures the SPI communication.
- cleanup_spi_gpio() ensures proper cleanup after use
- check_gpio_conflicts() ensures no other processes are using the GPIO lines.
Tip: Debugging GPIO issues? Try running
sudo raspi-gpio getto see the current state of each pin. It’s a quick way to identify conflicts or misconfigured pins.
Implementing Real-Time Data Streaming

This is where things get interesting. Real-time EEG data streaming is the core functionality of our application. By using WebSockets, we’ll send data continuously from the Flask backend to the front-end, ensuring that EEG data is visualized without any lag or delay.
Setup WebSocket Communication: Implement the read_eeg_data_brainflow() function in app.py to capture data and emit it through Socket.IO. This function will continuously read, process, and send data.
def read_eeg_data_brainflow():
    global collected_data
    try:
        board = BoardShim(BoardIds.PIEEG_BOARD.value, params)
        board.prepare_session()
        board.start_stream(45000, '')

        while running:
            data = board.get_current_board_data(fs)
            eeg_channels = BoardShim.get_eeg_channels(BoardIds.PIEEG_BOARD.value)
            data_transposed = data[eeg_channels, :]

            logging.info(f"Raw BrainFlow data: {data_transposed}")

            if data_transposed.size == 0:
                logging.error("No data retrieved from BrainFlow")
                continue

            data_transposed = data_transposed.tolist()  # Convert to list for easier processing

            # Reset collected_data for each new read
            collected_data = [[] for _ in range(len(eeg_channels))]

            for idx, channel_data in enumerate(data_transposed):
                collected_data[idx].extend(channel_data)

            logging.info(f"Processed BrainFlow data: {data_transposed}")

            socketio.emit('update_data', {
                'raw': [channel[0] for channel in data_transposed]  # Send only the latest data points
            })
            time.sleep(1)

        board.stop_stream()
        board.release_session()
    except BrainFlowError as e:
        logging.error(f"BrainFlow error: {str(e)}")
    except Exception as e:
        logging.error(f"Unexpected error: {e}")
Apply Filters and Normalization: EEG signals are notoriously noisy. Adding a bandpass filter to read_eeg_data_brainflow() in app.py and performing baseline correction can significantly improve signal quality.
 # Apply BrainFlow filters if enabled
if bandpass_enabled:  # Assume this variable is set based on the checkbox
    for channel in eeg_channels:
        try:
            DataFilter.detrend(data_transposed[channel], DetrendOperations.CONSTANT.value)
            DataFilter.perform_bandpass(data_transposed[channel], BoardShim.get_sampling_rate(BoardIds.PIEEG_BOARD.value), 3.0, 45.0, 2, FilterTypes.BUTTERWORTH_ZERO_PHASE, 0)
            DataFilter.perform_bandstop(data_transposed[channel], BoardShim.get_sampling_rate(BoardIds.PIEEG_BOARD.value), 48.0, 52.0, 2, FilterTypes.BUTTERWORTH_ZERO_PHASE, 0)
            DataFilter.perform_bandstop(data_transposed[channel], BoardShim.get_sampling_rate(BoardIds.PIEEG_BOARD.value), 58.0, 62.0, 2, FilterTypes.BUTTERWORTH_ZERO_PHASE, 0)
        except Exception as e:
            logging.error(f"Error applying filters to channel {channel}: {e}")

# Normalize REF channel if necessary
ref_channel_index = 0  # Assuming REF channel is the first in eeg_channels
ref_values = data_transposed[ref_channel_index]
ref_mean = ref_values.mean()
ref_std = ref_values.std()

logging.info(f"REF Channel - Mean: {ref_mean}, Std Dev: {ref_std}")

# Normalize if the mean is significantly higher than expected
if ref_mean > 1000:  # This threshold can be adjusted based on expected range
    data_transposed[ref_channel_index] = (ref_values - ref_mean) / ref_std
    logging.info(f"Normalized REF Channel - Mean: {data_transposed[ref_channel_index].mean()}, Std Dev: {data_transposed[ref_channel_index].std()}")
Key Points:
- Filters: This section applies optional filters (bandpass, baseline correction).
- WebSocket Streaming: socketio.emit() sends the processed data to the client for real-time visualization.
Tip: Visualize raw data first before applying filters. This helps you understand what noise looks like in your specific setup and avoid accidentally removing valuable signal information.
Creating the Analysis Control Routes

The Flask server will also handle control routes for starting and stopping the analysis. Use HTTP POST requests to toggle the analysis state and manage background threads. This provides a clean interface for integrating with the front-end controls.
Create the start_analysis() Route in app.py: This will initialize the BrainFlow session and start streaming data.
@app.route('/start-analysis', methods=['POST'])
def start_analysis():
    global running
    running = True
    cleanup_spi_gpio()  # Ensure no conflicts before starting BrainFlow

    if check_gpio_conflicts():
        return jsonify({"status": "GPIO conflict detected. Please resolve before starting BrainFlow."}), 409

    threading.Thread(target=read_eeg_data_brainflow, daemon=True).start()
Create the stop_analysis() Route in app.py: Gracefully stop the analysis, ensuring all resources are released.
@app.route('/stop-analysis', methods=['POST'])
def stop_analysis():
    global running
    running = False
    time.sleep(1)  # Ensure threads have time to exit
    cleanup_spi_gpio()
    socketio.emit('analysis_stopped')  # Notify frontend to update the settings
    return jsonify({"status": "Analysis stopped"})
Tip: Gracefully handle errors here. If the board isn’t properly initialized, BrainFlow can throw exceptions that crash your server. Wrap sensitive code in
try...exceptblocks.
Implementing Advanced Data Processing Options

To give users more control, add an update_settings() route in app.py to update settings like bandpass filtering and baseline correction when they are changed. These options will be configurable through the front-end and applied dynamically during data streaming.
Implement the update_settings() route:
@app.route('/update-settings', methods=['POST'])
def update_settings():
    global lowcut, highcut, order, baseline_correction_enabled, enabled_channels, ref_enabled, biasout_enabled, bandpass_enabled, smoothing_enabled, acquisition_method
    data = request.json
    lowcut = float(data.get('lowcut', lowcut))
    highcut = float(data.get('highcut', highcut))
    order = int(data.get('order', order))
    baseline_correction_enabled = data.get('baseline_correction_enabled', baseline_correction_enabled)
    enabled_channels = int(data.get('enabled_channels', enabled_channels))
    ref_enabled = data.get('ref_enabled', ref_enabled)
    biasout_enabled = data.get('biasout_enabled', biasout_enabled)
    bandpass_enabled = data.get('bandpass_filter_enabled', bandpass_enabled)
    smoothing_enabled = data.get('smoothing_enabled', smoothing_enabled)
    logging.info(f"Updated settings: lowcut={lowcut}, highcut={highcut}, order={order}, baseline_correction_enabled={baseline_correction_enabled}, enabled_channels={enabled_channels}, ref_enabled={ref_enabled}, biasout_enabled={biasout_enabled}, bandpass_enabled={bandpass_enabled}, smoothing_enabled={smoothing_enabled}")
    return jsonify({"status": "Settings updated"})
Tip: Make sure to validate user inputs on the server-side. Unexpected values (e.g., a negative cutoff frequency for a filter) can cause your app to behave unpredictably.
Managing Calibration and Signal Integrity

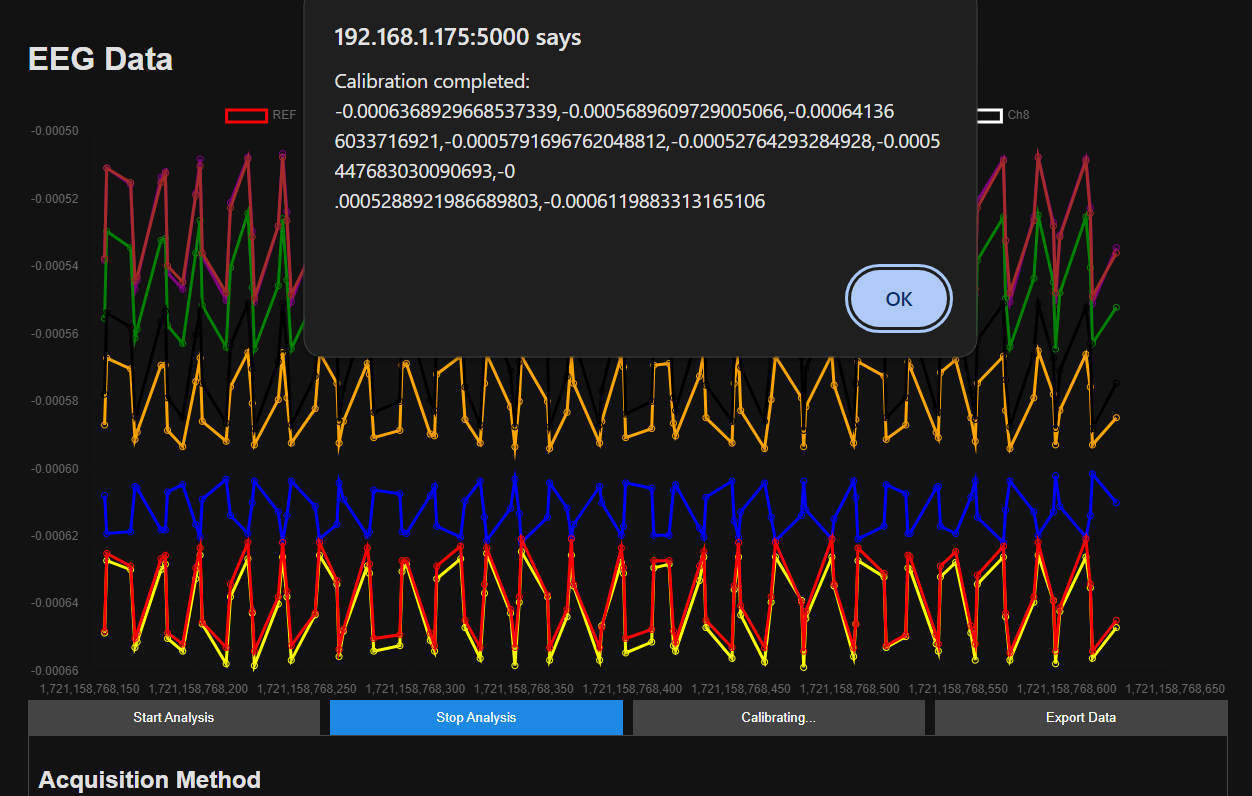
Calibration routines establish a reliable baseline for the EEG data, reducing noise and ensuring accurate readings. Create a dedicated function to collect and average data over a few seconds to establish calibration values.
Implement a Calibration Routine in app.py: This should run a brief session and compute the mean for each channel, storing the values for later use.
def calibrate():
    global calibration_values
    try:
        logging.info("Starting calibration process")
        board = BoardShim(BoardIds.PIEEG_BOARD.value, params)
        board.prepare_session()
        board.start_stream(45000, '')

        calibration_duration = 5  # seconds
        calibration_data = [[] for _ in range(enabled_channels)]

        start_time = time.time()
        while time.time() - start_time < calibration_duration:
            data = board.get_current_board_data(250)
            eeg_channels = BoardShim.get_eeg_channels(BoardIds.PIEEG_BOARD.value)
            data_transposed = data[eeg_channels, :]

            if data_transposed.size == 0:
                logging.error("No data retrieved from BrainFlow")
                continue

            for idx, channel_data in enumerate(data_transposed):
                calibration_data[idx].extend(channel_data)

        calibration_values = [np.mean(ch_data) for ch_data in calibration_data]
        logging.info(f"BrainFlow calibration values: {calibration_values}")

        board.stop_stream()
        board.release_session()

    except BrainFlowError as e:
        logging.error(f"BrainFlow calibration error: {str(e)}")
    except Exception as e:
        logging.error(f"Unexpected calibration error: {e}")
Use Calibration for Real-Time Normalization: Subtract the calibration values from incoming data to minimize drift. Update read_eeg_data_brainflow() in app.py to include baseline correction.
# Apply baseline correction if enabled
if baseline_correction_enabled:  # Assume this variable is set based on the checkbox
    for idx in range(len(eeg_channels)):
        data_transposed[idx] -= calibration_values[idx]
Tip: Run the calibration routine multiple times to get a sense of the baseline variability. If values fluctuate too much, consider optimizing your setup (e.g., electrode placement).
Exporting EEG Data for Offline Analysis
Implement the data export functionality in app.py to allow users to save their EEG recordings for further analysis. This is crucial for researchers who want to dive deeper into the sessions and compare multiple recordings.
Implement the /export_data route:
@app.route('/export-data')
def export_data():
    try:
        num_rows = int(request.args.get('num_rows', 5000))
        if num_rows > len(collected_data[0]):
            num_rows = len(collected_data[0])
        csv_data = create_csv([ch[:num_rows] for ch in collected_data])
        return Response(
            csv_data,
            mimetype='text/csv',
            headers={'Content-Disposition': 'attachment;filename=eeg_data.csv'}
        )
    except Exception as e:
        logging.error(f"Error exporting data: {e}")
        return Response(
            "Internal Server Error",
            status=500
        )
Implement the create_csv() function which is called by /export-data:
# Function to create CSV data
def create_csv(data):
    import csv
    import io
    output = io.StringIO()
    writer = csv.writer(output)
    writer.writerow(['Channel' + str(i+1) for i in range(len(data))])
    for row in zip(*data):
        writer.writerow(row)
    output.seek(0)
    return output.getvalue()
Part 3: Building the Front-End Interface and Integrating with the Flask Server

Designing the HTML Structure
The front-end is where users will interact with the EEG analysis app, configure settings, and visualize brainwave data in real time. We’ll start by building a clean and intuitive interface using HTML.
- Create a new folder inside your flask project folder called
templates. This folder will hold our apps HTML pages. - Creaete a new file called
index.html. This file will hold all of the UI elements for our front-end.
Create index.html:
<!-- v0.1a-->
<!DOCTYPE html>
<html lang="en">
<head>
    <meta charset="UTF-8">
    <title>EEG Data</title>
    <meta name="viewport" content="width=device-width, initial-scale=1.0">
    <script src="https://cdn.socket.io/4.0.0/socket.io.min.js"></script>
    <script src="https://cdn.jsdelivr.net/npm/chart.js"></script>
    <script src="static/js/app.js"></script>
    <link rel="stylesheet" href="static/styles.css">
</head>
<body>
    <div class="container">
        <h1>EEG Data</h1>
        <canvas id="eegChart"></canvas>
        <div class="controls">
            <button id="startBtn" onclick="startAnalysis()">Start Analysis</button>
            <button id="stopBtn" onclick="stopAnalysis()" disabled>Stop Analysis</button>
            <button id="calibrateBtn" onclick="startCalibration()">Start Calibration</button>
            <button id="exportBtn" onclick="exportData()">Export Data</button>
        </div>
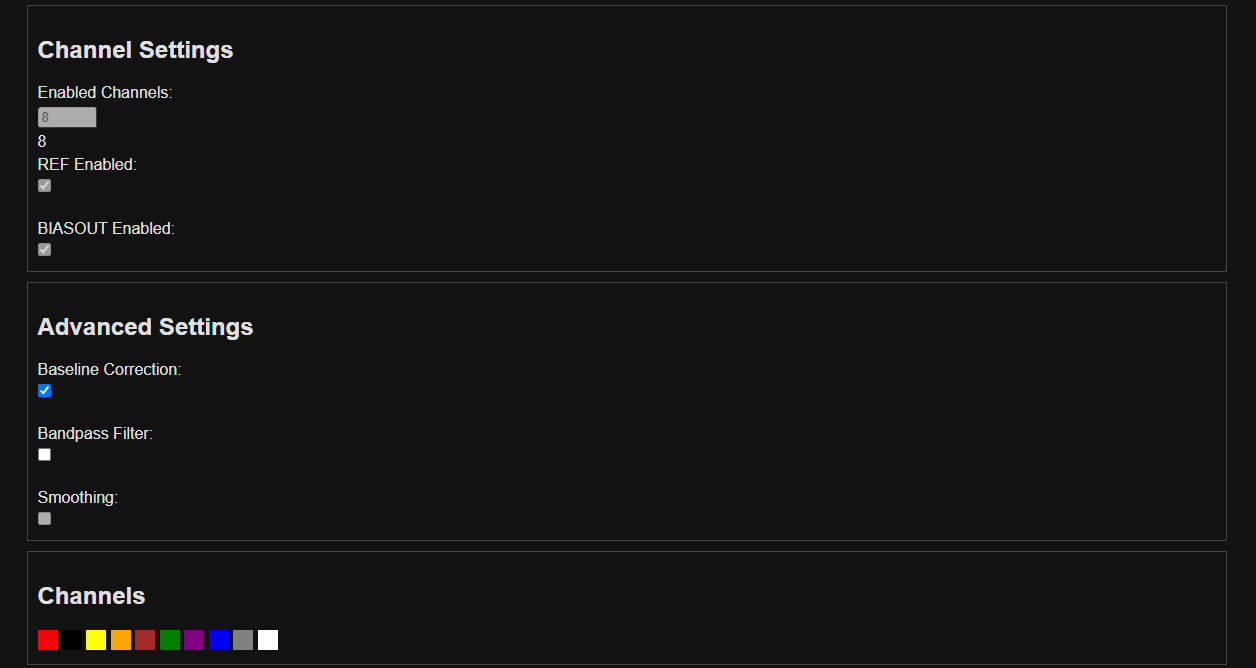
        <div class="section">
            <h2>Channel Settings</h2>
            <label for="enabled_channels">Enabled Channels:</label>
            <input type="number" id="enabled_channels" name="enabled_channels" min="1" max="8" value="8" oninput="updateSettings()">
            <span id="enabledChannelsValue">8</span>
            <br>
            <label for="ref_enabled">REF Enabled:</label>
            <input type="checkbox" id="ref_enabled" name="ref_enabled" checked onchange="updateSettings()">
            <br>
            <label for="biasout_enabled">BIASOUT Enabled:</label>
            <input type="checkbox" id="biasout_enabled" name="biasout_enabled" checked onchange="updateSettings()">
        </div>
        <div class="section">
            <h2>Advanced Settings</h2>
            <label for="baseline_correction_enabled">Baseline Correction:</label>
            <input type="checkbox" id="baseline_correction_enabled" name="baseline_correction_enabled" checked onchange="updateSettings()">
            <br>
            <label for="bandpass_filter_enabled">Bandpass Filter:</label>
            <input type="checkbox" id="bandpass_filter_enabled" name="bandpass_filter_enabled" onchange="updateSettings()">
        </div>
        <div class="section">
            <h2>Channels</h2>
            <div class="color-box" data-label="REF" style="background-color: red;"></div>
            <div class="color-box" data-label="BIASOUT" style="background-color: black;"></div>
            <div class="color-box" data-label="Ch1" style="background-color: yellow;"></div>
            <div class="color-box" data-label="Ch2" style="background-color: orange;"></div>
            <div class="color-box" data-label="Ch3" style="background-color: brown;"></div>
            <div class="color-box" data-label="Ch4" style="background-color: green;"></div>
            <div class="color-box" data-label="Ch5" style="background-color: purple;"></div>
            <div class="color-box" data-label="Ch6" style="background-color: blue;"></div>
            <div class="color-box" data-label="Ch7" style="background-color: grey;"></div>
            <div class="color-box" data-label="Ch8" style="background-color: white;"></div>
        </div>
    </div>
</body>
</html>
Styling the Interface with CSS
Next use CSS to style the interface, making it visually appealing and easy to navigate. Proper styling enhances usability and provides a better overall user experience.
- Create a new folder in the root of your project directory and name it
static. This folder will hold our style sheets and JavaScript. - Creaete a new file called
styles.css.
Create styles.css:
body {
    background-color: #121212;
    color: #e0e0e0;
    font-family: Arial, sans-serif;
}
.container {
    width: 90%;
    max-width: 1200px;
    margin: auto;
    padding: 20px;
}
canvas {
    width: 100%;
    height: 400px;
}
.controls {
    display: flex;
    flex-wrap: wrap;
    gap: 10px;
}
.controls > * {
    flex: 1;
}
.section {
    border: 1px solid #444;
    padding: 10px;
    margin-bottom: 10px;
}
button {
    padding: 10px;
    background-color: #1e88e5;
    color: white;
    border: none;
    cursor: pointer;
}
button:disabled {
    background-color: #444;
}
label, input, select {
    display: block;
    margin: 5px 0;
}
input[type="range"] {
    width: 100%;
}
.color-box {
    width: 20px;
    height: 20px;
    display: inline-block;
    cursor: pointer;
}
@media (max-width: 600px) {
    .controls {
        flex-direction: column;
    }
}
Implementing the JavaScript for Real-Time Interactivity
JavaScript is the magic behind our front-end interactivity. We will use it to manage WebSocket connections, update the chart in real time, and handle user input. The script needs to ensure seamless communication with the Flask server, dynamically updating the chart based on incoming data.
- Creaete a new folder inside the static folder and name it
js. This folder will hold our front-end's JavaScript. - Create a new file called
app.js.
Creaete app.js:
// Global Variables
let ctx, eegChart;
const socket = io();

// Color Configuration for EEG Channels
const colors = {
    ref: 'red',
    biasout: 'black',
    ch1: 'yellow',
    ch2: 'orange',
    ch3: 'brown',
    ch4: 'green',
    ch5: 'purple',
    ch6: 'blue',
    ch7: 'grey',
    ch8: 'white'
};

// Initialize the Chart When DOM is Ready
document.addEventListener("DOMContentLoaded", function () {
    ctx = document.getElementById('eegChart').getContext('2d');
    updateSettings(); // Initial settings load
    setupColorBoxListeners(); // Enable color-box click events
});

// WebSocket Event Listener for Updating the Chart with Real-Time Data
socket.on('update_data', function (data) {
    if (eegChart.data.labels.length > 100) {
        eegChart.data.labels.shift();
        eegChart.data.datasets.forEach(dataset => dataset.data.shift());
    }
    eegChart.data.labels.push(Date.now());
    eegChart.data.datasets.forEach((dataset, index) => {
        if (data.raw && data.raw.length > index) {
            dataset.data.push({ x: Date.now(), y: data.raw[index] });
        }
    });
    eegChart.update();
});

// Create and Update the Chart Based on Current Settings
function createChart() {
    if (eegChart) eegChart.destroy();

    const datasets = [];
    const enabledChannels = parseInt(document.getElementById('enabled_channels').value, 10);

    // Add Channels Based on Settings
    if (document.getElementById('ref_enabled').checked) {
        datasets.push({ label: 'REF', data: [], borderColor: colors.ref, fill: false });
    }
    if (document.getElementById('biasout_enabled').checked) {
        datasets.push({ label: 'BIASOUT', data: [], borderColor: colors.biasout, fill: false });
    }

    for (let i = 0; i < enabledChannels; i++) {
        datasets.push({ label: `Ch${i + 1}`, data: [], borderColor: colors[`ch${i + 1}`], fill: false });
    }

    // Create Chart.js Line Chart
    eegChart = new Chart(ctx, {
        type: 'line',
        data: { labels: [], datasets: datasets },
        options: { animation: false, scales: { x: { type: 'linear' }, y: { type: 'linear' } } }
    });
}

// Update Settings from the Front-End Controls
function updateSettings() {
    const enabledChannels = document.getElementById('enabled_channels').value;
    document.getElementById('enabledChannelsValue').innerText = enabledChannels;
    createChart();

    // Send Updated Settings to the Server
    fetch('/update-settings', {
        method: 'POST',
        headers: { 'Content-Type': 'application/json' },
        body: JSON.stringify({
            baseline_correction_enabled: document.getElementById('baseline_correction_enabled').checked,
            enabled_channels: enabledChannels,
            ref_enabled: document.getElementById('ref_enabled').checked,
            biasout_enabled: document.getElementById('biasout_enabled').checked,
            bandpass_filter_enabled: document.getElementById('bandpass_filter_enabled').checked,
        })
    });
}

// Start the Real-Time EEG Analysis
function startAnalysis() {
    disableControls(true);
    fetch('/start-analysis', { method: 'POST' }).catch(err => console.error('Failed to start analysis:', err));
}

// Stop the Real-Time EEG Analysis
function stopAnalysis() {
    disableControls(false);
    fetch('/stop-analysis', { method: 'POST' }).catch(err => console.error('Failed to stop analysis:', err));
}

// Start Calibration Process
function startCalibration() {
    disableControls(true);
    const btn = document.getElementById('calibrateBtn');
    btn.innerText = 'Calibrating...';
    fetch('/calibrate', { method: 'POST' })
        .then(response => response.json())
        .then(data => {
            alert('Calibration completed: ' + data.values);
            btn.innerText = 'Start Calibration';
            disableControls(false);
        })
        .catch(error => {
            alert('Calibration failed: ' + error);
            btn.innerText = 'Start Calibration';
            disableControls(false);
        });
}

// Export EEG Data to CSV
function exportData() {
    const numRows = prompt("Enter the number of rows to export:", 5000);
    fetch(`/export-data?num_rows=${numRows}`)
        .then(response => response.blob())
        .then(blob => {
            const url = window.URL.createObjectURL(blob);
            const a = document.createElement('a');
            a.style.display = 'none';
            a.href = url;
            a.download = 'eeg_data.csv';
            document.body.appendChild(a);
            a.click();
            window.URL.revokeObjectURL(url);
        })
        .catch(err => console.error('Error exporting data:', err));
}

// Helper to Enable or Disable Controls
function disableControls(disable) {
    document.getElementById('startBtn').disabled = disable;
    document.getElementById('stopBtn').disabled = !disable;
    document.getElementById('calibrateBtn').disabled = disable;
    document.getElementById('exportBtn').disabled = disable;
    document.getElementById('enabled_channels').disabled = disable;
    document.getElementById('ref_enabled').disabled = disable;
    document.getElementById('biasout_enabled').disabled = disable;
    document.getElementById('bandpass_filter_enabled').disabled = disable;
}

// Setup Color Box Listeners for Hiding/Showing Channels
function setupColorBoxListeners() {
    const colorBoxes = document.querySelectorAll('.color-box');
    colorBoxes.forEach(box => {
        box.addEventListener('click', function () {
            const label = this.getAttribute('data-label');
            const dataset = eegChart.data.datasets.find(ds => ds.label === label);
            if (dataset) {
                dataset.hidden = !dataset.hidden;
                eegChart.update();
            }
        });
    });
}
Explanation of Key JavaScript Functions
- WebSocket Listeners: The JavaScript listens for incoming data and updates the chart accordingly.
- Dynamic Chart Updates: Each time new data arrives, the chart is updated in real time.
- User Input Handling: Users can start/stop the analysis, change channels, and configure filters from the interface.
Running the Application
With both the backend and front-end components set up, it’s time to run the complete EEG analysis application. Start the Flask server and open the web interface to see the real-time EEG data visualization.
-
Start the Flask Server:
python main.py -
Access the Web Interface: Open your web browser and go to
http://<your-raspberry-pi-ip>:5000. -
Interacting with the Interface: Use the controls to start/stop the analysis, configure settings, and observe the real-time EEG data on the chart.
Final Testing Checklist
- Real-Time Data Accuracy: Verify that the EEG data displayed matches expected patterns (e.g., alpha and beta waves).
- Interface Responsiveness: Ensure that all buttons and controls respond quickly to user inputs.
- Data Export: Test the CSV export functionality with different session lengths.
Conclusion
Congratulations! You’ve successfully built a real-time EEG analysis app using Flask, BrainFlow, and PiEEG. This project showcases the power of open-source tools and hardware in creating complex biosignal applications.
With a fully functioning system, you can now explore advanced use cases like neurofeedback, brain-computer interaction, or integrating machine learning models for cognitive state classification.
